My Favorite Chart Pattern for Long-Term Investing (And Why I Keep Coming Back to It)
Most chart patterns come and go. The ones worth paying attention to tend to repeat for years.

When I look for long-term investment opportunities, I’m not searching for complicated indicators or dozens of signals. I prefer a simple approach that focuses on trend, support, and price behavior.
One pattern has consistently stood out.
The 201 EMA Pullback and Breakout Pattern
The foundation of my process is the weekly 201 EMA.
y=EMA_{201}
The 201 EMA helps me identify whether a stock is in a healthy long-term uptrend. When price stays above a rising 201 EMA, it often signals institutional strength and long-term momentum.
What makes this pattern interesting is what happens after the trend is established.
Many strong stocks eventually pull back toward the 201 EMA, spend some time consolidating, and then break above a trendline or resistance area before continuing higher.
This sequence appears surprisingly often.
What I Look For
My checklist is simple:
Price above a rising weekly 201 EMA
Pullback toward the EMA
Consolidation near support
Trendline or resistance breakout
Strong weekly close after the breakout
The goal is not to buy at any price. The goal is to wait for the stock to show that buyers are stepping back in.
The Pattern Repeats Across Different Stocks
One reason I like this setup is that it isn’t limited to a single sector or market phase.
Looking at stocks such as Tech Mahindra, Redington, Anant Raj, Vadilal Industries, and Datamatics, a similar theme appears repeatedly:
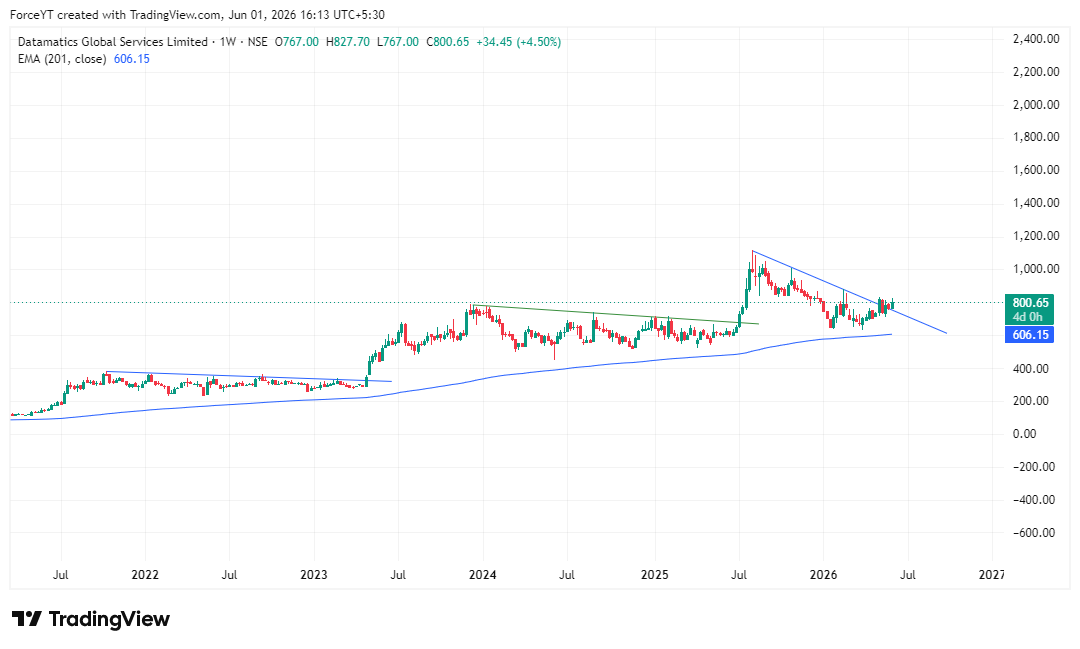
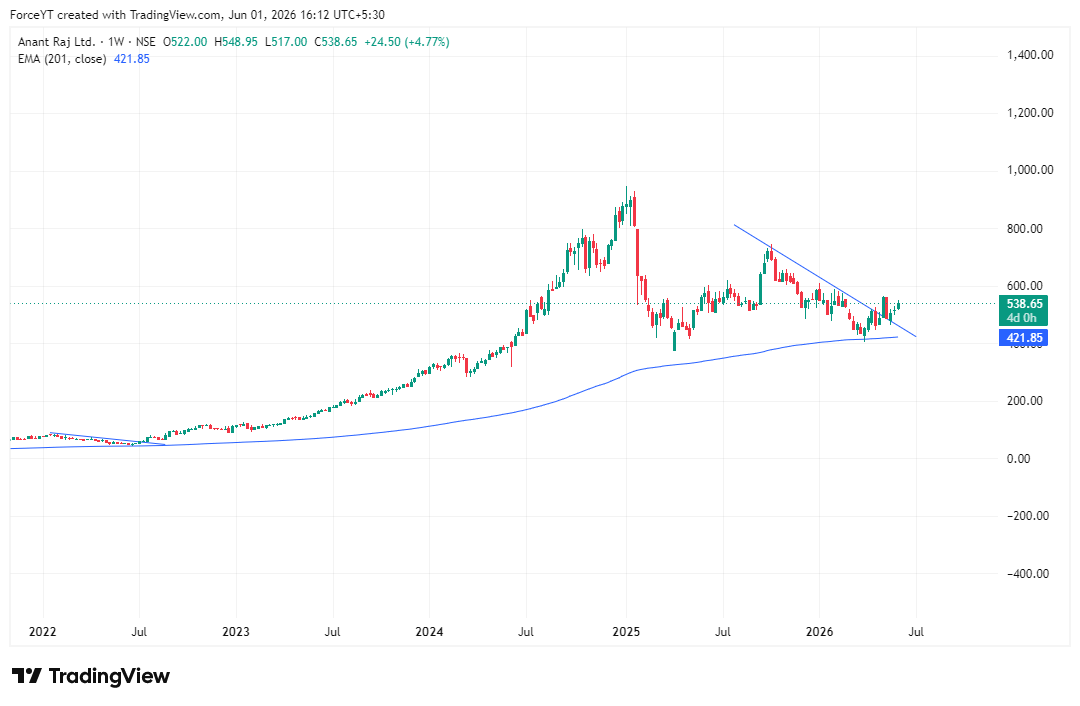
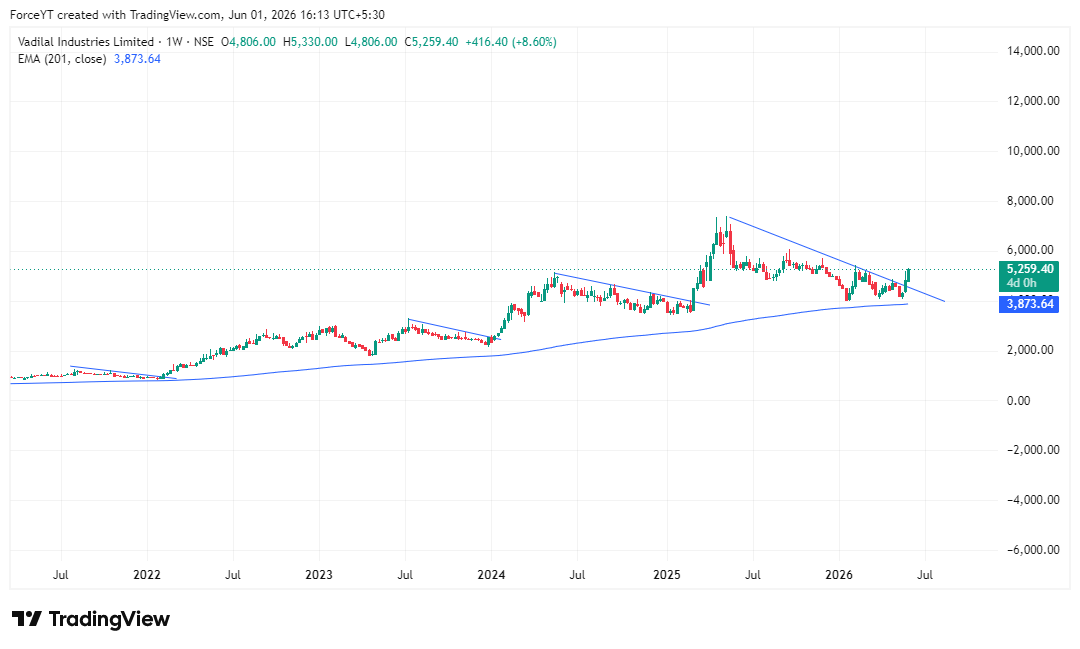
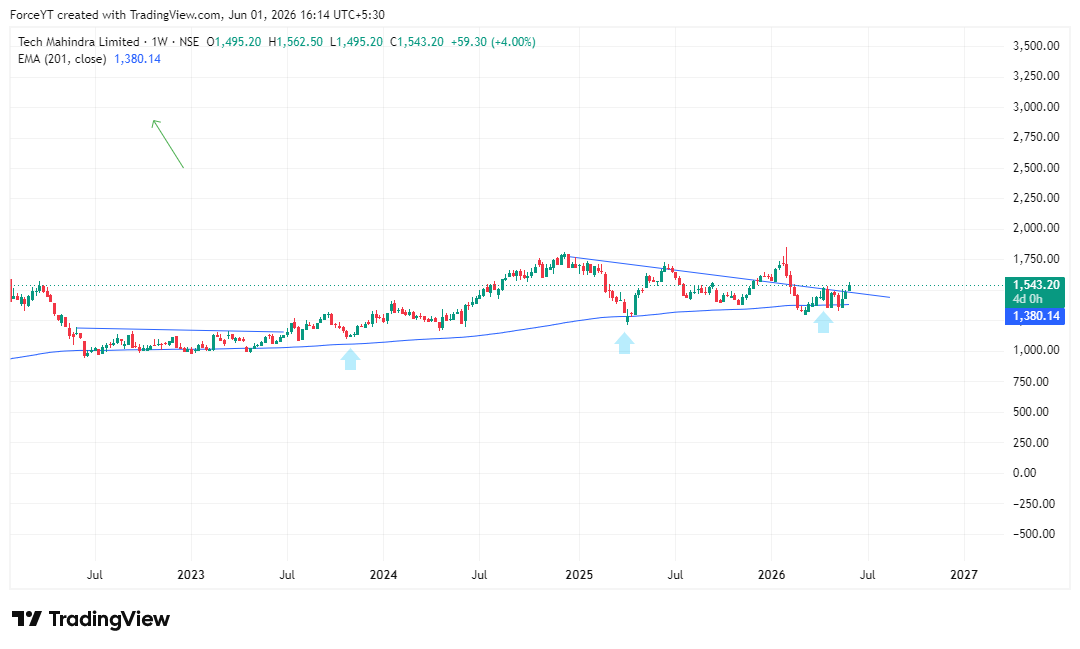
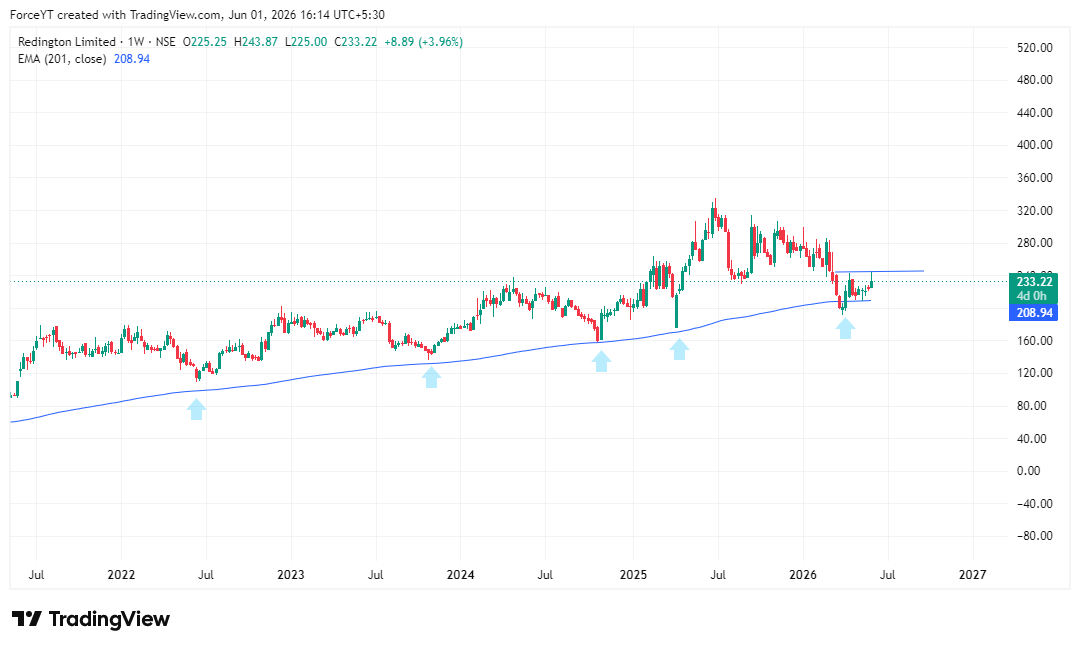
Price respects the rising 201 EMA, consolidates, forms a tightening structure, and eventually breaks higher.
The exact shape changes, but the underlying behavior remains remarkably similar.
That consistency is what makes the pattern valuable.
Why a Scanner Makes a Huge Difference
The challenge is not understanding the setup.
The challenge is finding it.
India has thousands of listed stocks. Manually reviewing every chart is time-consuming and often leads to information overload.
That’s why I use a scanner that detects these conditions automatically.
Instead of searching through more than 6,000 stocks, the scanner filters the market and highlights only the stocks that match my criteria.
This removes a lot of noise and allows me to focus on analysis rather than endless searching.
The scanner doesn’t make the decision for me.
It simply brings the highest-quality candidates to my attention.
A Practical Lesson
Over time, I’ve realized that successful investing is often about recognizing recurring behavior.
Stocks rarely move in straight lines. They trend, pull back, consolidate, and then reveal their next move.
The weekly 201 EMA pullback and breakout pattern gives me a structured way to identify those opportunities while staying aligned with the larger trend.
Simple does not mean easy.
But simple is often repeatable.
Want to See the Exact Scanner and Rules?
I’ve documented the scanner settings and the complete strategy I use to identify these 201 EMA pullback and breakout setups.
If you’d like to save time and focus only on high-quality opportunities, you can explore the full guide and scanner resources through Below.